Phase diagram of the TlGaS2–CdS system and optical properties of a TlGaS2:Cd2+
crystal
Chem.
Met. Alloys 10 (2017)
142-148
https://doi.org/10.30970/cma10.0369
Lyudmyla Piskach, Galyna Myronchuk, Ganna Makhnovets
The phase diagram of the TlGaS2–CdS system is of the eutectic type, with the coordinates
1021 K, ~80 mol.%
TlGaS2 / ~20 mol.% CdS.
The solid solubility of the components is less than 5 mol.%
at 670 K. The optical properties of a
single crystal of composition 98 mol.% TlGaS2 / 2 mol.% CdS, grown by the Bridgman method, were investigated. Absorption measurements were performed in the
100-300 K range with 50 K
increments. The bandgap energies for direct (Egd)
and indirect (Egi) transitions in TlGaS2:Cd2+
were calculated as a function of temperature.
They were found to be 2.38 and 2.32 eV at 100 K, and 2.27 and 2.2 eV at 300 K, i.e. the bandgap
for indirect optical transitions is smaller than the bandgap
for direct transitions. The values of the direct and indirect bandgap energies decrease with increasing temperature,
whereas the steepness parameter and Urbach energy
increase with increasing temperature in the range 100‑300 K. The Urbach energy was calculated
as 163 meV at 100 K and 239 meV at 300 K.
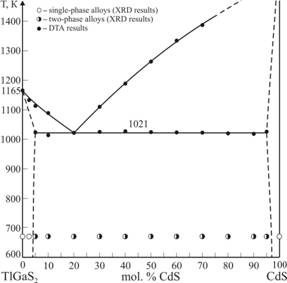
Phase diagram of the TlGaS2–CdS
system.
Keywords
Phase equilibria / Crystal growth / Differential thermal analysis / X-ray diffraction / Urbach energy / Steepness
parameter